Note
Access to this page requires authorization. You can try signing in or changing directories.
Access to this page requires authorization. You can try changing directories.
Monitoring workloads that use Foundry Models is straightforward when you enable diagnostics and use built-in dashboards. However, this strategy doesn't satisfy several common monitoring requirements for generative AI workloads, such as:
Tracking usage by client and model to manage quotas and implement chargeback solutions.
Logging model inputs and outputs for auditing scenarios and model performance monitoring.
This article examines the requirements these monitoring scenarios address, the challenges of implementing the scenarios, and the benefits and costs of incorporating a gateway into each scenario. Your decision to include a gateway depends on whether the extra observability justifies the added complexity.
For more information about monitoring model deployments, see Monitor model deployments in Microsoft Foundry Models.
The following diagram illustrates Foundry Models deployment monitoring that doesn't use a gateway. A gateway isn't required for this topology.

Track model usage
Many workloads or organizations need to track model usage by client and across all Foundry resources. Organizations use this information to:
- Implement a chargeback system that allocates usage costs to the appropriate organization or application owner.
- Budget and forecast future usage.
- Tie model cost and usage to model performance.
If you use native monitoring functionality to track service telemetry, be aware of the following challenges:
For chargeback models, you must associate AI model token usage with an application or business unit. Native Foundry Models metrics provide model and deployment dimensions, but they don't identify the originating client IP address or application.
Foundry resources in various regions are probably configured to send logs to a Log Analytics workspace in their local regions. You must aggregate logs from different workspaces or query across workspaces before you can analyze usage across all deployments.
Introduce a gateway to track model usage
Introduce a gateway into this topology to capture the full client IP address, a validated Microsoft Entra ID claim, or a custom identifier for a business unit, tenant, or application. The gateway can also centralize telemetry across multiple Foundry resources and deployments. You can then use this data to implement a chargeback solution for budgeting and forecasting and to run cost-benefit analyses of models.
In the following diagram, the gateway sends client, model, and token-usage telemetry to Azure Monitor. Separately, both Foundry resources send their native metrics and logs to Azure Monitor.

Example queries to track model usage
The following examples use Azure API Management for the gateway. The usage-monitoring example uses the ApiManagementGatewayLogs table and applies to all API operations. You must enable API Management gateway logs and response-body logging. Response-body logging is disabled by default and limits each captured response body to a specific size, so large responses might be truncated.
For language model logging, add a diagnostic setting to your API Management instance that sends logs related to generative AI gateway to your Log Analytics workspace. These logs write to the ApiManagementGatewayLlmLog table.
To audit prompts and completions, also enable logging LLM messages, logging prompts, and logging completions in the API's Azure Monitor diagnostic log settings. Prompt and completion logging is optional and can capture sensitive data. Large messages split into entries that have sequence numbers, and request messages and response messages have fixed size limits.
Example query for usage monitoring
let llmLogs = ApiManagementGatewayLlmLog
  | where TimeGenerated > ago(1h)
  | where isnotempty(DeploymentName)
  | summarize arg_max(TimeGenerated, *) by CorrelationId, RequestId,
  SequenceNumber;
  let gatewayLogs = ApiManagementGatewayLogs
  | where TimeGenerated > ago(1h)
  | summarize arg_max(
      TimeGenerated,
      ApimSubscriptionId,
      CallerIpAddress
  ) by CorrelationId
  | project
      CorrelationId,
      SubscriptionId = ApimSubscriptionId,
      CallerIpAddress;
  llmLogs
  | join kind=leftouter gatewayLogs on CorrelationId
  | extend
      SubscriptionId = iff(isempty(SubscriptionId), "(no subscription)",
      SubscriptionId),
      CallerIpAddress = iff(isempty(CallerIpAddress), "(unknown)",
      CallerIpAddress),
      ModelName = iff(isempty(ModelName), DeploymentName, ModelName)
  | summarize
      LlmCalls = count(),
      MeteredCalls = countif(TotalTokens > 0),
      ZeroTokenCalls = countif(TotalTokens == 0),
      StreamingCalls = countif(IsStreamCompletion),
      SumPromptTokens = sum(PromptTokens),
      SumCompletionTokens = sum(CompletionTokens),
      SumTotalTokens = sum(TotalTokens),
      AvgPromptTokens = round(avgif(todouble(PromptTokens), TotalTokens
      > 0), 2),
      AvgCompletionTokens = round(avgif(todouble(CompletionTokens),
      TotalTokens > 0), 2),
      AvgTotalTokens = round(avgif(todouble(TotalTokens), TotalTokens >
      0), 2),
      P95TotalTokens = percentile(TotalTokens, 95),
      MaxTotalTokens = max(TotalTokens)
      by SubscriptionId, CallerIpAddress, DeploymentName, ModelName
  | extend
      PromptTokenPercent = iff(
          SumTotalTokens > 0,
          round(100.0 * SumPromptTokens / SumTotalTokens, 2),
          0.0
      ),
      CompletionTokenPercent = iff(
          SumTotalTokens > 0,
          round(100.0 * SumCompletionTokens / SumTotalTokens, 2),
          0.0
      )
  | order by SumTotalTokens desc
The Log Analytics query result table shows the caller IP address, deployed model, sum of prompt tokens, sum of completion tokens, and sum of total tokens. Each row groups usage for one IP-address-and-model combination, which lets readers compare input, output, and combined token consumption by client and model.
Example query for prompt usage monitoring
ApiManagementGatewayLogs
| extend operationId = tolower(OperationId),
    responseBody = parse_json(BackendResponseBody)
| where operationId in (
    'createresponse',
    'completions_create',
    'chatcompletions_create'
)
| extend model = tostring(responseBody.model),
    prompttokens = coalesce(
        tolong(responseBody.usage.prompt_tokens),
        tolong(responseBody.usage.input_tokens)
    )
| mv-expand responseOutput = iff(
    operationId == 'createresponse',
    responseBody.output,
    dynamic([{}])
)
| where operationId != 'createresponse'
    or tostring(responseOutput.type) == 'message'
| mv-expand responseContent = iff(
    operationId == 'createresponse',
    responseOutput.content,
    dynamic([{}])
)
| where operationId != 'createresponse'
    or tostring(responseContent.type) == 'output_text'
| extend prompttext = substring(
    case(
        operationId == 'createresponse', tostring(responseContent.text),
        operationId == 'chatcompletions_create',
            tostring(responseBody.choices[0].message.content),
        tostring(responseBody.choices[0].text)
    ),
    0,
    100
)
The prompt usage monitoring query results show the generated time, model, prompt tokens, and prompt text.
Audit model inputs and outputs
Many auditing requirements for generative AI workloads depend on monitoring model inputs and outputs. For example, you might need to know whether a response came from a model, from a cache, or from an orchestration layer. In most scenarios, you should apply auditing rules uniformly across all models for both inputs and outputs.
The following use cases apply to monitoring model inputs:
Threat detection: Analyze inputs to identify and mitigate potential security risks.
Usage guideline violation detection: Analyze inputs for offensive language or other usage standard violations so that the system remains professional, safe, and unbiased.
Model performance: Combine input data and model outputs as a signal to evaluate groundedness and relevance. Use this information and other metrics your workload collects to address model or prompt performance problems.
The following use cases apply to monitoring model outputs:
Data exfiltration detection: Analyze outputs to guard against unauthorized transfer of sensitive information.
Stateful compliance: Monitor outputs across multiple interactions in the same conversation to detect stealthy leaks of sensitive information.
Compliance: Ensure that outputs adhere to corporate guidelines and regulatory requirements. For example, ensure that models don't provide legal advice or make financial promises.
Model performance: Combine output data and model inputs as a signal to evaluate groundedness and relevance. Use this information and other metrics your workload collects to address model or prompt performance problems.
Challenges of auditing model inputs and outputs directly from the model
Model logging constraints: Some services don't log model inputs and outputs.
Caching: Complex architectures might serve responses from a cache. Those scenarios don't call the model, so they can't log the input or output.
Stateful conversations: A multi-interaction conversation state might be stored outside the model. The model doesn't know which interactions belong to which conversation.
Multiple-model architecture: The orchestration layer might dynamically invoke multiple models to generate a final response.
Introduce a gateway to audit model inputs and outputs
Introduce a gateway into this topology to capture both the original client input and the final output that returns to the client. Because the API Management gateway sits between the client and the backend services, it can observe the full request and response path.
The gateway can return a cached response or route a request through private endpoints. In the following diagram, the gateway sends captured client inputs and final outputs to Azure Monitor. In a separate telemetry flow, both Foundry resources send native metrics and logs to Azure Monitor.

The gateway can log both the client's request and the final response that it returns. This capability applies whether the response comes directly from a model, is aggregated from multiple backends, or comes from a cache. If the clients pass a conversation identifier, the gateway can log that identifier with the input and output, and you can use this implementation to correlate multiple interactions of a conversation.
Monitoring inputs and outputs at the gateway lets you apply auditing rules consistently across all models.
Near real-time monitoring
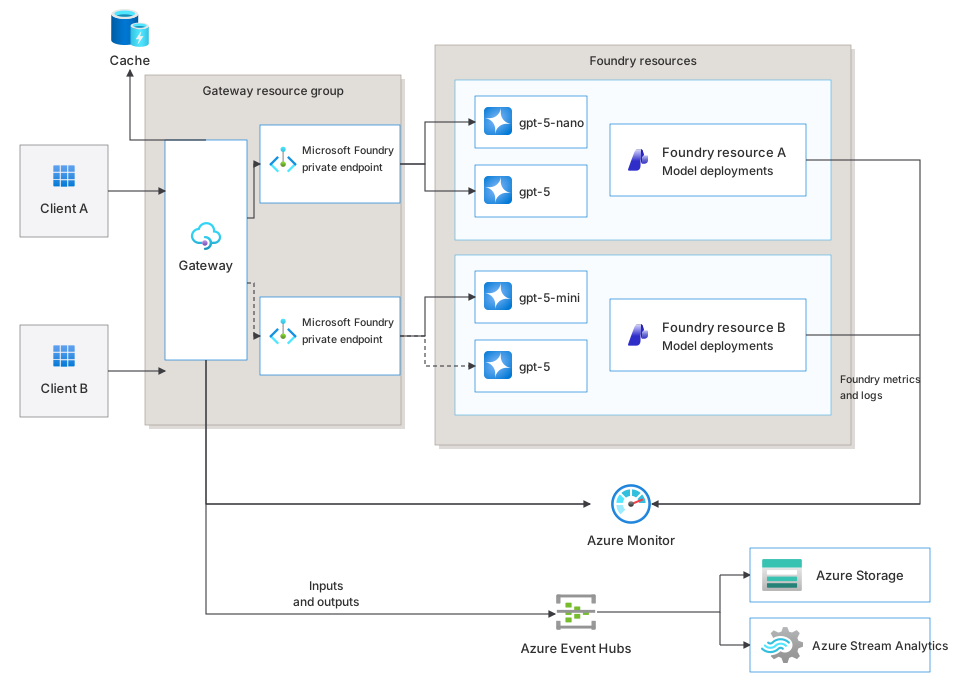
Azure Monitor resource logs aren't optimized for near-real-time processing because of the inherent latency in log data ingestion. If your solution requires low-latency monitoring, send gateway telemetry to an event-streaming platform such as Azure Event Hubs. Use a stream processor or consumer such as Azure Stream Analytics to generate the required analysis and alerts, and write the data to storage separately from the operational logging pipeline.
In the following diagram, API Management gateway and both Foundry resources send operational telemetry to Azure Monitor through two distinct flows. For lower-latency analysis, the gateway also sends input and output events through Azure Event Hubs to Azure Storage and Azure Stream Analytics.
Considerations when introducing a gateway for monitoring
Latency: Introducing a gateway into your architecture adds latency to responses. Ensure that the observability benefits outweigh the performance implications.
Security and privacy: Ensure that monitoring data collected by the gateway adheres to customer privacy expectations and established security requirements. Avoid storing prompts, responses, or identifiers unless you need them for a defined business or compliance requirement. Continue to treat any sensitive data captured through monitoring as sensitive data.
Reliability: Treat the gateway as a request-path dependency. Select a tier and redundancy configuration that meets the workload's availability target, and define whether requests fail as closed or continue without monitoring when the telemetry path is unavailable. Use fail-closed behavior when compliance requirements outweigh the workload's availability requirement.
Implementation: You can use an out-of-the-box gateway such as API Management with the required configuration, or you can implement these capabilities in an orchestration layer that already exists in the request path.
Telemetry standardization: For a custom gateway or orchestration layer, use OpenTelemetry to emit correlated traces, metrics, and logs. Include consistent model, deployment, token-usage, latency, and approved client or tenant attributes. The Azure Monitor OpenTelemetry Distro can send this telemetry to Application Insights. Use the OpenTelemetry generative AI semantic conventions that your instrumentation library supports, and version any custom attributes because generative AI conventions continue to evolve.
Reasons to avoid introducing a gateway for monitoring
If a single application accesses a single model, the added complexity of introducing a gateway probably outweighs the monitoring benefits. In that scenario, the client can often handle the responsibility of logging inputs and outputs and correlating usage to the application identity. The gateway becomes beneficial when you need to monitor multiple clients or multiple models.
Next steps
Related resources
- A gateway implementation for your workload provides benefits beyond the tactical, multiple back-end routing benefit described in this article. For more information, see Access language models through a gateway.
- Design a well-architected AI workload.