Collect VM client event logs
- 7 minutes
Performance data helps identify anomalies. Linux Syslog provides additional event data that can help investigate them. The performance data collection rule (DCR) from the previous unit doesn't collect Syslog. You now create a separate DCR that sends selected Syslog events to the same Log Analytics workspace.
Before you begin
Confirm that monitored-linux-vm has Azure Monitor Agent (AMA) installed, a managed identity configured, and access to the required Azure Monitor endpoints. Record the region of the Log Analytics workspace selected in the previous unit.
This exercise uses public Azure Monitor endpoints. It doesn't configure Private Link or an Azure Monitor Private Link Scope (AMPLS).
Note
Linux Syslog collection uses a supported Syslog daemon such as rsyslog or syslog-ng. The daemon forwards messages to AMA using the configuration installed for collection. AMA doesn't automatically collect every event that exists only in the systemd journal.
Create the Syslog DCR
In the Azure portal, open Monitor > Data Collection Rules and select Create.
If the default creation experience opens, use its banner link to switch to the classic creation experience. The following steps use Platform Type and Add data source from that experience.
On Basics, enter collect-events-linux for the rule name.
Select your subscription and learn-monitor-vm-rg. For Region, select the region of the destination Log Analytics workspace.
For Platform Type, select Linux. Leave Data Collection Endpoint unselected for this public-endpoint Syslog exercise.

On Resources, select Add resources, select monitored-linux-vm, and select Apply. Don't select Enable Data Collection Endpoints.

On Collect and deliver, select Add data source, then Linux Syslog.
Configure the user, daemon, and syslog facilities with minimum level Warning (shown as LOG_WARNING in some portal views). Set other facilities to NONE for this exercise. If using the bulk selector, select the intended facilities and apply the minimum level, then confirm the resulting level on each row.
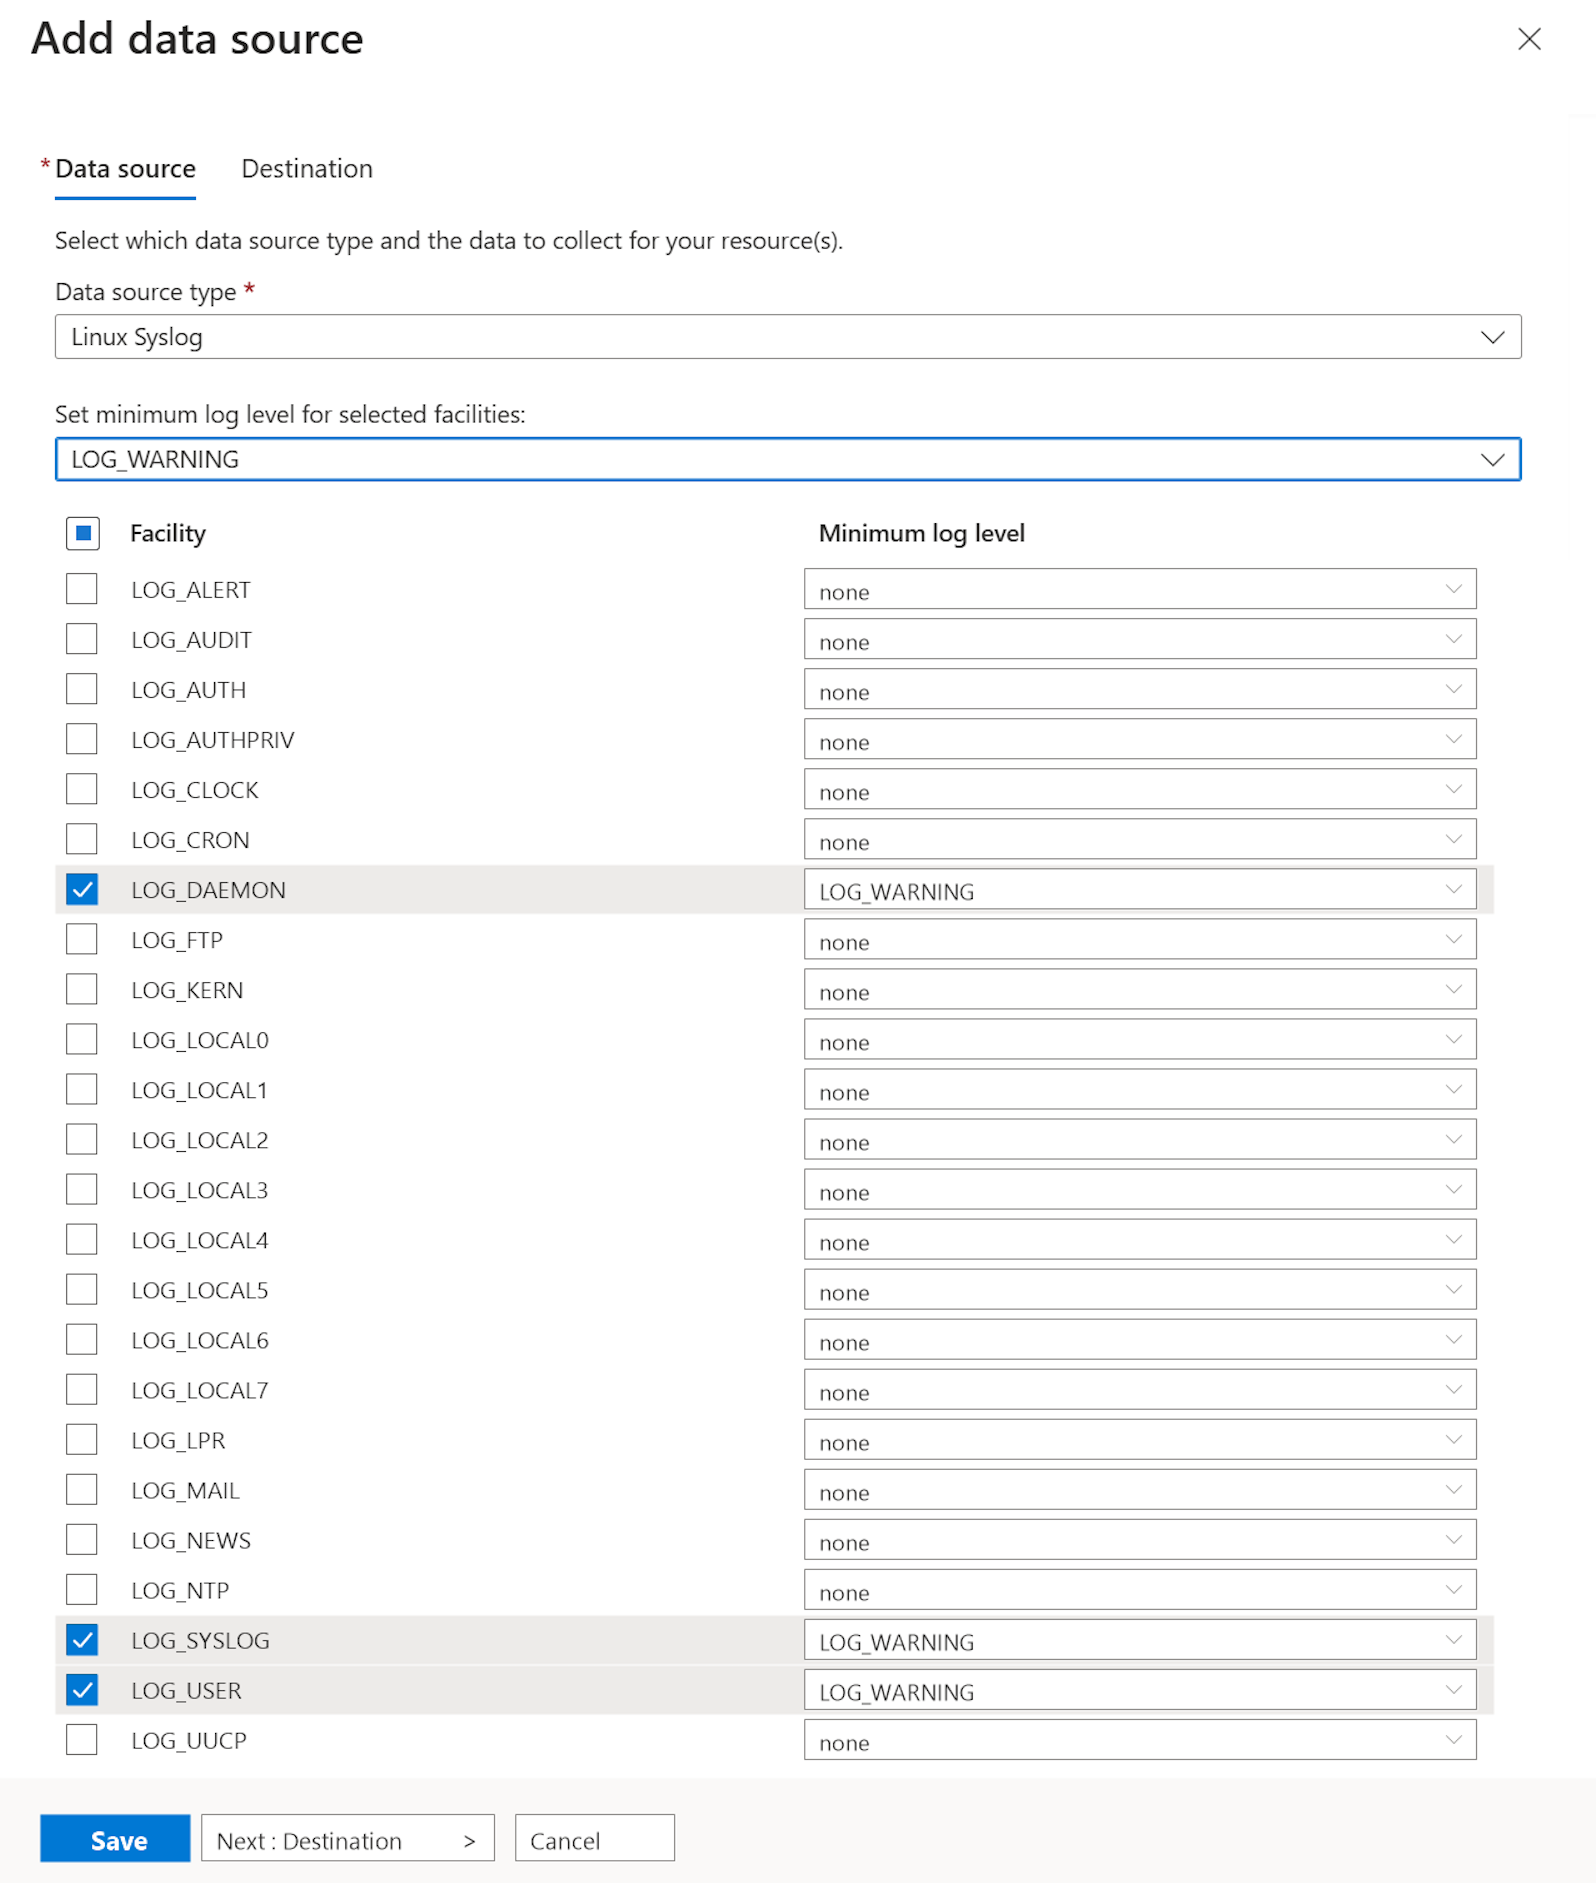
On Destination, select Azure Monitor Logs and the exact Log Analytics workspace used for performance collection.
Select Add data source, then Review + create, and Create.
Open the DCR's Resources page and confirm that the intended VM is associated. Allow several minutes for the configuration to reach the agent.


The minimum level includes Warning and more-severe events for the selected facilities. It doesn't mean "Warning only," and it doesn't collect unselected facilities. For more information, see Collect Syslog events with AMA and Create a VM data collection rule.
Important
A DCE isn't required for this public-endpoint Syslog path. Private Link deployments, including AMA networks that share DNS with AMPLS resources, need additional endpoint and DNS configuration. Follow the DCE requirements and Private Link guidance for that topology instead of treating this lab as a private-network recipe. Other data sources can also have their own DCE requirements.
Generate an event that matches the DCR
On the VM, select Operations > Run command > RunShellScript. This executes on the Linux VM, not in the local computer's terminal.
Enter the following commands and select Run to check that the Syslog daemon and agent are active:
systemctl is-active rsyslog
systemctl is-active azuremonitoragent
Both should report active. If either is inactive, resolve the service/configuration problem before continuing. Use the AMA Syslog troubleshooting guidance rather than assuming collection succeeded.
After the previous command completes and the DCR has reached the agent, replace the script with the following command and select Run:
logger -p user.warning -t learn-monitor-vm "learn-monitor-vm syslog test"
This creates one warning event in the user facility, matching the configured filter. Run Command uses the Azure VM agent and requires its documented outbound connectivity; it doesn't require opening an inbound SSH port.
View the collected event
Open Logs from monitored-linux-vm. Confirm the resource scope is this VM.
If Simple mode is selected, switch to KQL mode. Close the example-query dialog if it opens.
Run the following query:
Syslog
| where TimeGenerated > ago(30m)
| where Facility == "user"
| where SeverityLevel == "warning"
| where SyslogMessage contains "learn-monitor-vm syslog test"
| project TimeGenerated, Computer, Facility, SeverityLevel, SyslogMessage
| order by TimeGenerated desc

The result should contain the test event. Data delivery isn't instantaneous. Allow several minutes; if the event was generated before the configuration arrived, generate a new event after confirming the association and agent health.
To inspect recent warnings across the collected facilities, run:
Syslog
| where TimeGenerated > ago(30m)
| where SeverityLevel == "warning"
| top 100 by TimeGenerated desc
Note
These queries assume the VM resource scope. If you open Logs from a workspace instead, constrain the query to the VM's full resource ID with an _ResourceId filter. A computer name alone might not uniquely identify a VM across a shared workspace. See Log Analytics modes and scope.
If the Syslog table isn't available yet or the query returns no matching records, check the DCR's destination and region, VM association, configured facility/severity values, Syslog daemon, AMA status, and network connectivity. This heartbeat query can help distinguish a disconnected agent from a Syslog-specific problem:
Heartbeat
| where TimeGenerated > ago(30m)
| where Category == "Azure Monitor Agent"
| top 20 by TimeGenerated desc
A heartbeat confirms agent communication, not successful Syslog collection. The matching Syslog record is the exercise's success criterion. For more information, see Troubleshoot AMA on Linux and Syslog query examples.
Feedback
Was this page helpful?
No
Need help with this topic?
Want to try using Ask Learn to clarify or guide you through this topic?