概览
目标: 在 Chrome DevTools 中查看请求
时间: 5 分钟
Plugins:DevToolsPlugin
先决条件:设置开发代理
默认情况下,开发人员代理在命令提示符中显示其消息。 如果您使用开发代理与发出大量请求的应用程序配合使用,可能会很难找到您感兴趣的消息。 更重要的是,你可能想要检查开发人员代理截获的请求和响应。
若要更轻松地查找感兴趣的消息,请使用 DevToolsPlugin 插件在 Chrome DevTools 中显示开发代理消息。
小窍门
开发代理支持将 Chrome DevTools 与 Microsoft Edge、Microsoft Edge Dev 和 Google Chrome 配合使用。
该 DevToolsPlugin 公开了 Dev Proxy 消息,以及在 Chrome DevTools 中截获的请求和响应的信息。
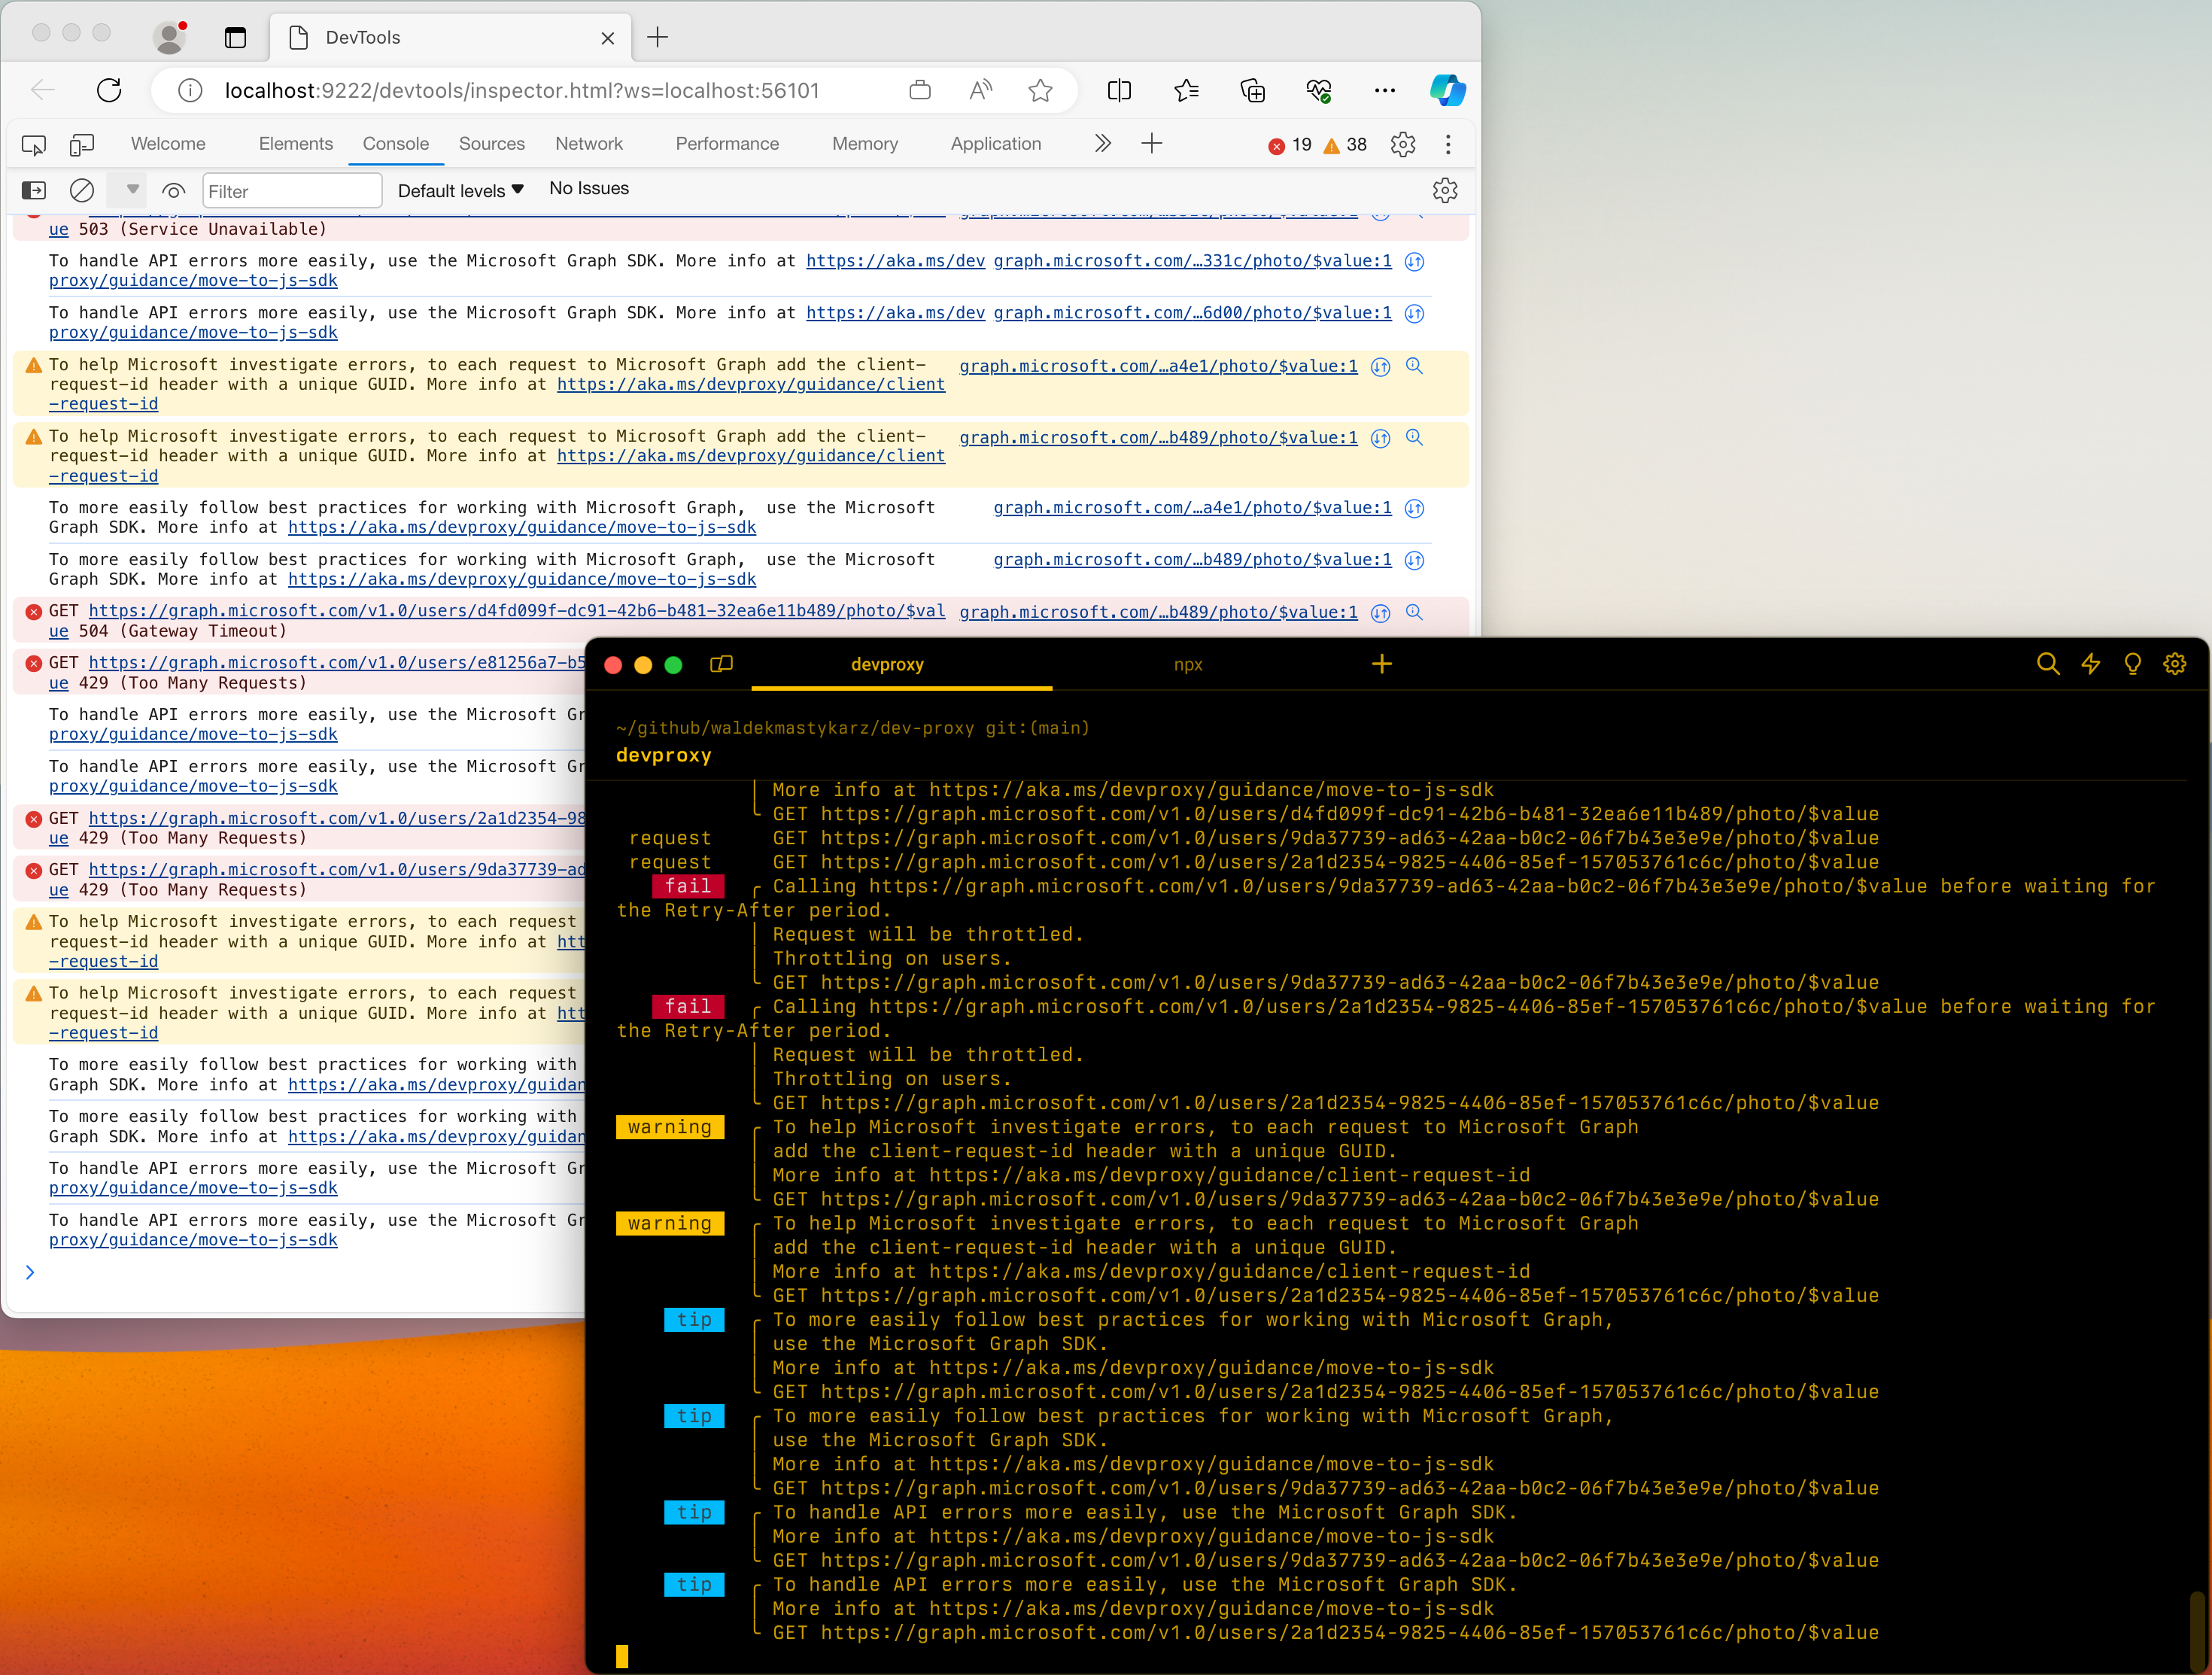
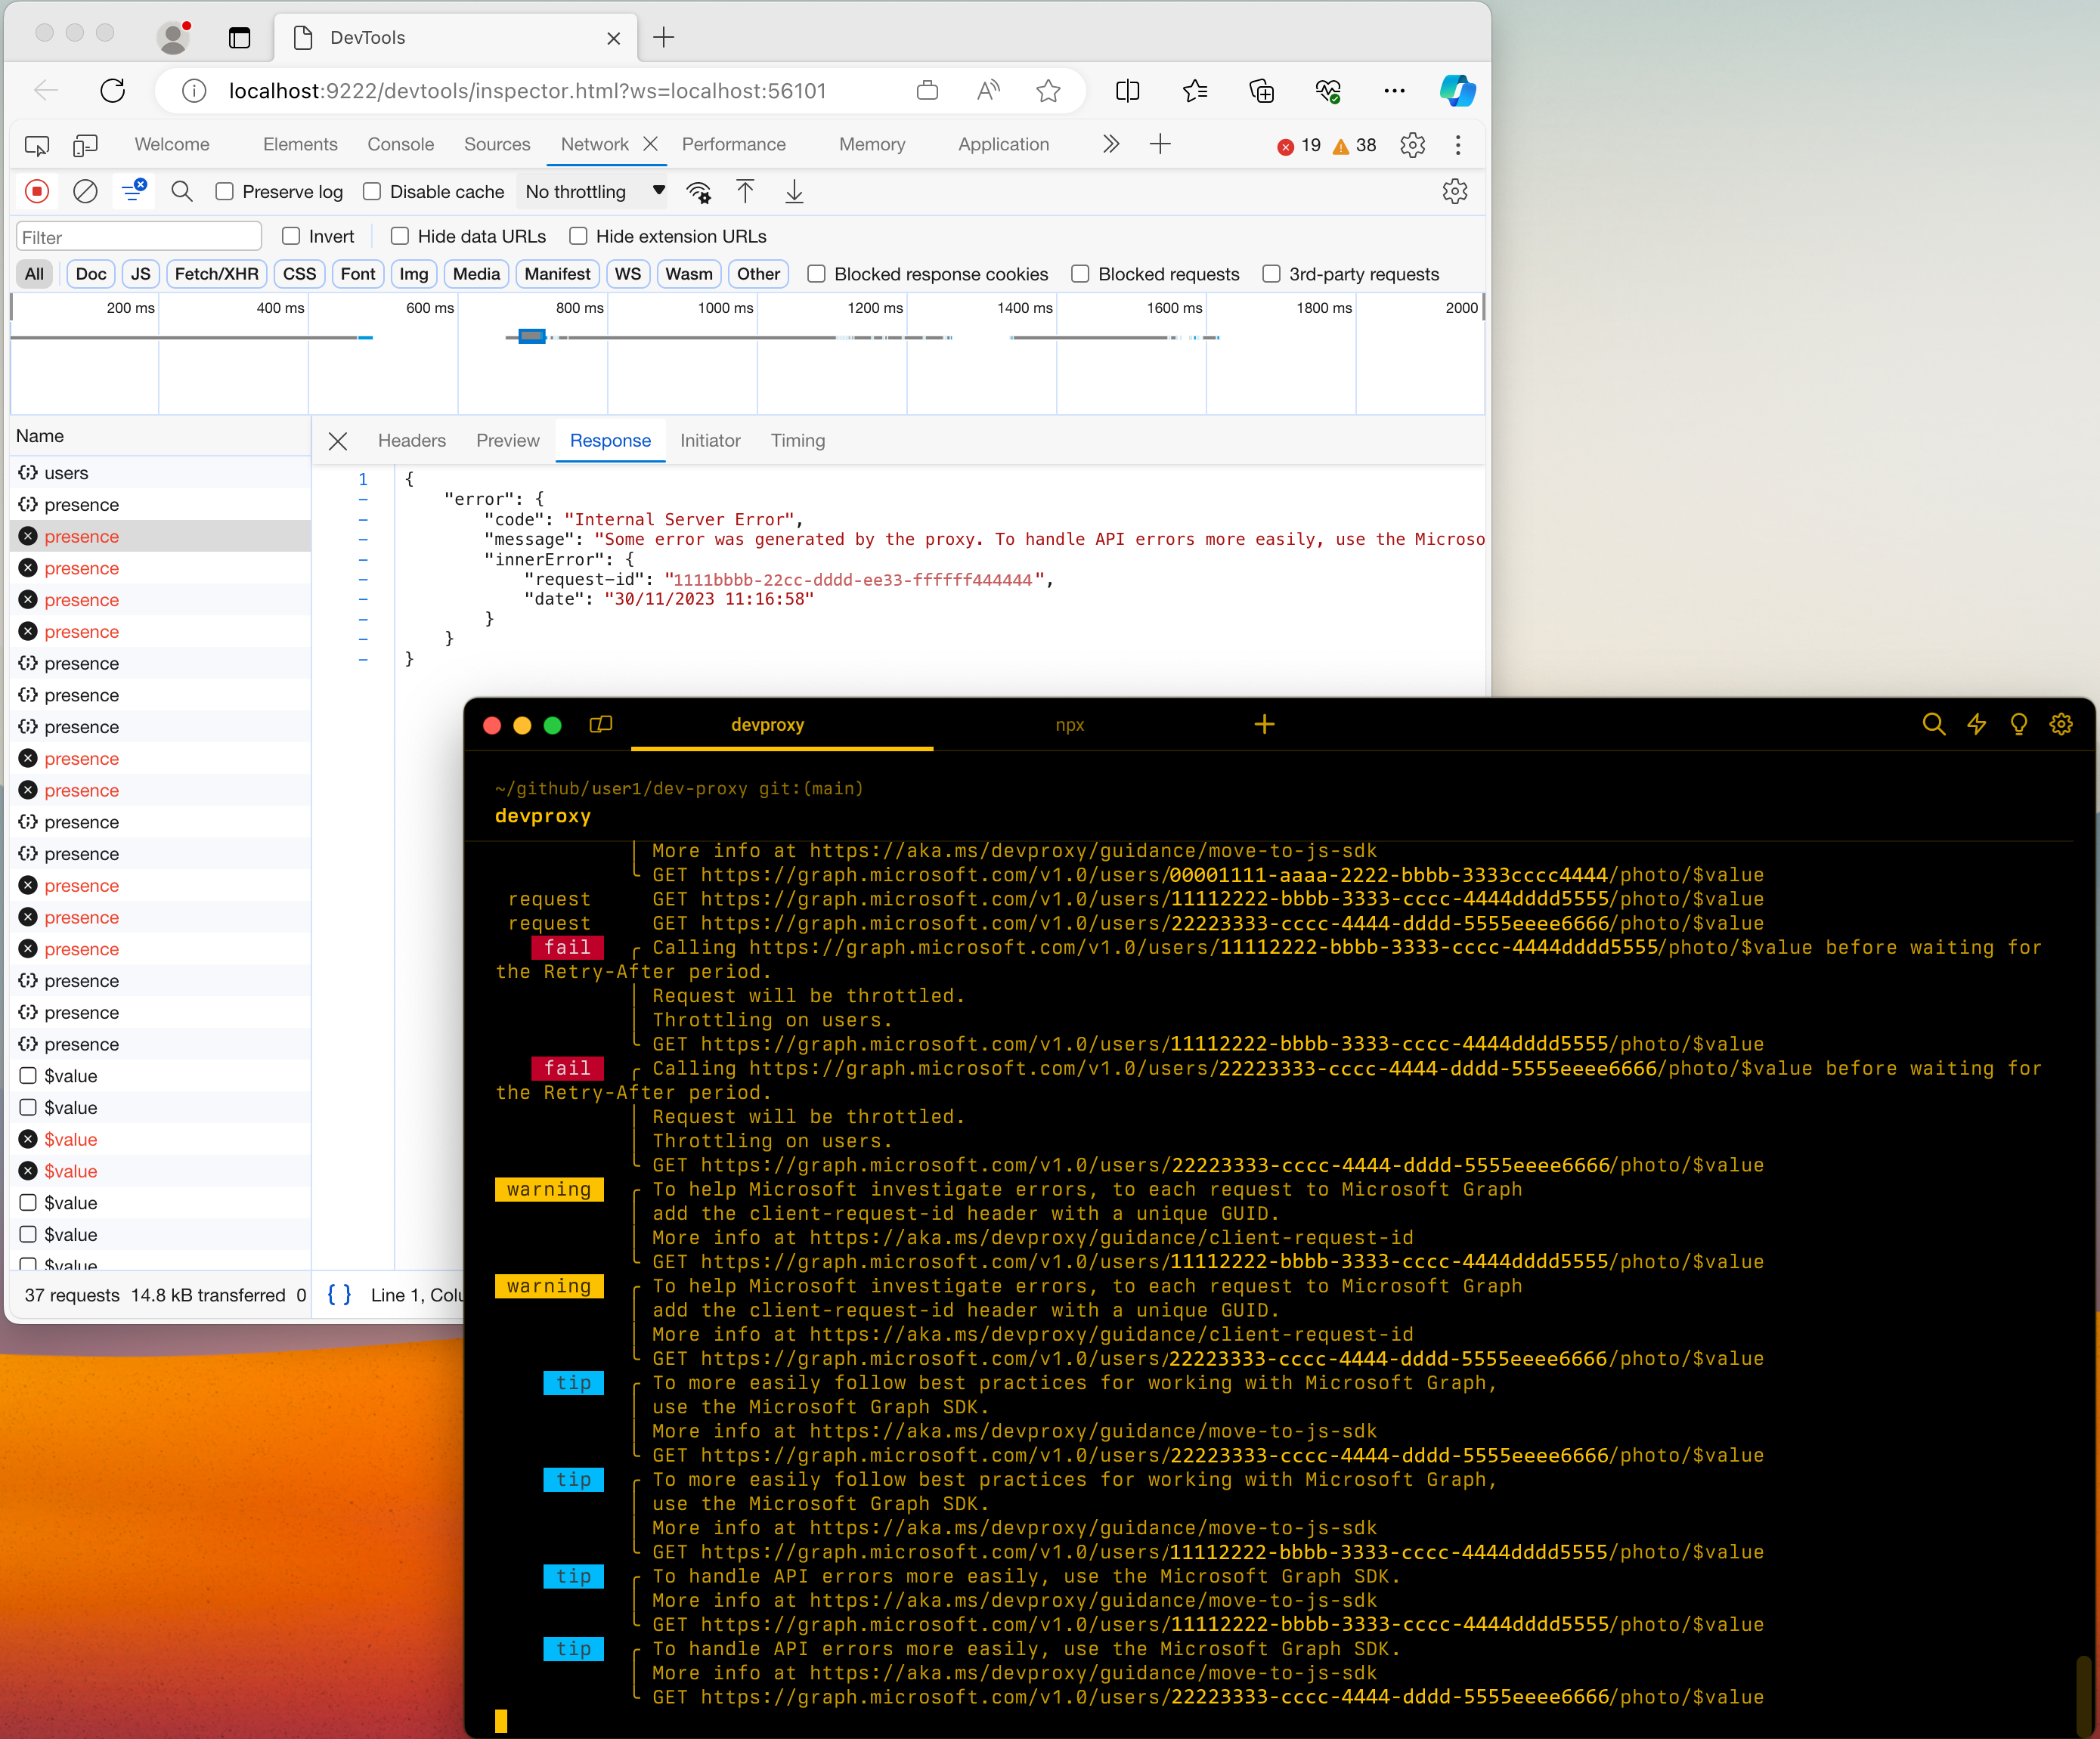
将 Chrome DevTools 与开发代理配合使用:
打开位于您的 Dev Proxy 安装目录中的 devproxyrc.json 文件。 也可使用
devproxy config open命令。DevToolsPlugin启用插件并添加devTools配置节。 支持preferredBrowser的值包括:Edge、、EdgeDevChrome。完整
devproxyrc.json文件如下所示:文件: devproxyrc.json
{
  "$schema": "https://raw.githubusercontent.com/dotnet/dev-proxy/main/schemas/v4.0.0/rc.schema.json",
  "plugins": [
    {
      "name": "DevToolsPlugin",
      "enabled": true,
      "pluginPath": "~appFolder/plugins/DevProxy.Plugins.dll",
      "configSection": "devTools"
    }
  ],
  "devTools": {
    "$schema": "https://raw.githubusercontent.com/dotnet/dev-proxy/main/schemas/v4.0.0/devtoolsplugin.schema.json",
    "preferredBrowser": "Edge"
  }
}
保存
devproxyrc.json文件,然后启动开发代理。
在容器中运行 Dev Proxy 时检查请求
在容器、开发容器或 GitHub Codespaces 中运行开发代理时,插件无法在计算机上启动浏览器。 而是将插件配置为侦听固定端口并记录开发人员工具 URL,并在计算机上的浏览器中打开该 URL。
在
devTools配置部分中,将port设置为固定端口,并将launchBrowser设置为false:文件: devproxyrc.json
{
  "$schema": "https://raw.githubusercontent.com/dotnet/dev-proxy/main/schemas/v4.0.0/rc.schema.json",
  "plugins": [
    {
      "name": "DevToolsPlugin",
      "enabled": true,
      "pluginPath": "~appFolder/plugins/DevProxy.Plugins.dll",
      "configSection": "devTools"
    }
  ],
  "devTools": {
    "$schema": "https://raw.githubusercontent.com/dotnet/dev-proxy/main/schemas/v4.0.0/devtoolsplugin.schema.json",
    "port": 19229,
    "launchBrowser": false
  }
}
将端口发布或转发到本机上的同一端口。 开发人员工具 URL 包含端口号,因此计算机上的端口必须与配置中的端口匹配。
如果使用 Dev Proxy Docker image,则在启动容器时发布端口:
docker run --rm -it -p 8000:8000 -p 8897:8897 -p 19229:19229 -v ${PWD}:/config ghcr.io/dotnet/dev-proxy:latestDocker 映像使用
--ip-address 0.0.0.0启动开发代理,因此该插件会侦听所有接口。 如果在自己的容器中运行开发代理并发布端口,也请使用--ip-address 0.0.0.0启动开发代理。如果将 开发代理与 Aspire 配合使用,请发布开发代理容器资源上的端口:
var devProxy = builder.AddDevProxyContainer("devproxy")
    .WithConfigFile("./devproxy.json")
    .WithCertFolder(".devproxy/cert")
    .WithConfigFolder(".devproxy/config")
    // publish the DevToolsPlugin port to the same port on the host
    .WithHttpEndpoint(port: 19229, targetPort: 19229, name: "devtools");
如果在 Visual Studio Code 中使用开发容器或 GitHub Codespaces,请将端口转发到本地计算机。
启动 Dev Proxy。 开发代理记录开发人员工具 URL,例如:
DevToolsPlugin available at devtools://devtools/bundled/inspector.html?ws=127.0.0.1:19229/<token>. Open this URL in Microsoft Edge or Google Chrome to inspect requests.复制 URL,并在计算机上的 Microsoft Edge 或 Google Chrome 中打开该 URL。
注意
开发代理每次启动时都会生成一个新令牌。 重启开发代理后,从日志中复制新 URL。
